 Kontakt
 Kako kupovati
Dostava
Savjetnik za kupnju
 Engleski
 80 b
80 b
Do 30 dana za povrat
Kupci su kupili i

 /
/
 Meki uvez
 15.02
€
15.02
€
 /
Meki uvez
41.34
€
/
Meki uvez
41.34
€


 /
Meki uvez
9.87
€
/
Meki uvez
9.87
€


 /
Tvrdi uvez
21.37
€
/
Tvrdi uvez
21.37
€


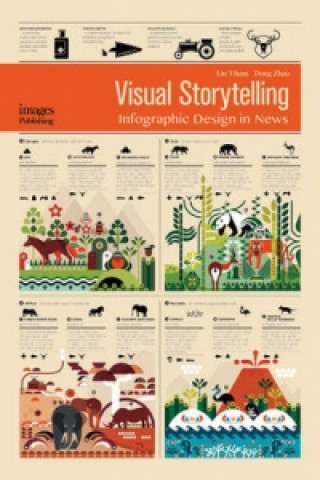
How do data journalism designers overcome information overload in today's fast-paced environment, and find simple and compelling methods to filter and convey news content? One of the most effective ways is to use dynamic infographics and data visualisations. The use of powerful graphics and illustrations will capture the viewer's attention and interest, and by burying boring data creatively, strong graphics will provide a clever and compelling visual story that's driven by accessible and clear communication. This book introduces the developmental history and characteristics of data journalism, describing its classification and the features of journalism published by world-renowned media. It focuses on the design and production of data journalism, explaining the basic elements of design, common design methods and includes showcase designs from the simple to the very complex. This volume helps show how and where to find opportunities to use creative graphics and illustrations, including hand-painted illustrations. This book is a must-have for professional designers and design students, or those readers who are interested in compelling visual storytelling through design.


Informacije o knjizi
Engleski

Poklonite ovu knjigu još danas
To je jednostavno
1 Dodajte knjigu u košaricu i odaberite isporuku kao poklon 2 Zauzvrat ćemo vam poslati kupon 3 Knjiga dolazi na adresu poklonoprimcaMoglo bi vas zanimati i


 /
Meki uvez
33.98
€
/
Meki uvez
33.98
€


Dobar dan! Ja sam Libroamiko, vaš književni savjetnik.
Kako vam mogu pomoći?