
 Kontakt
 Kako kupovati
Dostava
Savjetnik za kupnju
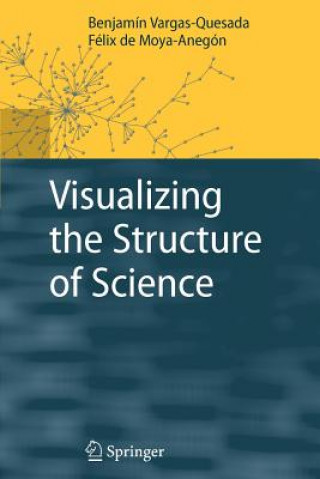
Visualizing the Structure of Science
 Engleski
 373 b
373 b
Do 30 dana za povrat
Kupci su kupili i
















This book presents a methodology for visualizing large scientific domains. Authors Moya-Anegón and Vargas-Queseda create science maps, so-called "scientograms", based on the interactions between authors and §their papers through citations and co-citations, using approaches such as domain analysis, social networks, cluster analysis and pathfinder networks. The resulting scientograms offer manifold possibilities.Constructing a great map of the sciences has been a persistent dream since the Middle Ages. In modern times this need has become even more urgent because of the requirement to combine and link research in adjacent areas, often resulting in new disciplines such as bioinformatics and nanotechnologies. Computer visualization helps humans to perceive and understand large and complex structures, such as molecular structures or data dependencies.§Vargas-Quesada and Moya-Anegón propose a methodology for visualizing large scientific domains. They create science maps, so-called "scientograms", based on the interactions between authors and their papers through citations and co-citations, using approaches such as domain analysis, social networks, cluster analysis and pathfinder networks. The resulting scientograms offer manifold possibilities. Domain analysts can discover the most significant connections between categories of a given domain, and they can also see how these categories are grouped into major thematic areas and how they are interrelated through a logical internal, while information scientists or researchers new to an area may appreciate a durable image of the essential structure of a domain.


Informacije o knjizi
Engleski

Poklonite ovu knjigu još danas
To je jednostavno
1 Dodajte knjigu u košaricu i odaberite isporuku kao poklon 2 Zauzvrat ćemo vam poslati kupon 3 Knjiga dolazi na adresu poklonoprimcaMoglo bi vas zanimati i






 /
/
 Meki uvez
 18.40
€
18.40
€
 /
Meki uvez
8.69
€
/
Meki uvez
8.69
€

 /
/
 Rokovnik
16.07
€
Rokovnik
16.07
€

 /
Meki uvez
19.31
€
/
Meki uvez
19.31
€













Dobar dan! Ja sam Libroamiko, vaš književni savjetnik.
Kako vam mogu pomoći?